Linnen et al. are interested in coloration of the deer mice (Peromyscus maniculatus) present on the light-colored soils of the Nebraska Sand Hills. Adaptation for crypsis is the strongest hypothesis to explain prevalence of the light morph compared to the black morph, and they wanted to dissect the genetic basis of this adaptation. This study is composed of two main parts : first to understand and to evaluate the complexity of coloration phenotype and then to find the mutations responsible of those variation in traits and on which morph selection is acting on. First of all, they implemented an experimentation with plasticine models to count the number of attacks on each coloration morph. As they expected, statistical test reveals that the dark models are significantly more attacked than light models. Closer inspection reveals multiple pigmentation traits and pattern that differ between the light and the dark morph to compose complex coloration phenotype (particularly for dorsal hue and brightness, ventral color, dorsal ventral boundary and tail stripe). In previous study, they found that recent change in dorsal fur to light color is mainly caused by a change at the Agouti locus.
Before looking at point mutation in this locus, they wanted to see if color and color pattern are, or not, dependant. Principal component analysis (PCA) reveals that the phenotypes in this wild population were largely independent suggesting multiples independent genetic control. To test this hypothesis, they used NGS to generate polymorphism data for ~2100 unlinked regions and a smaller region containing Agouti and all known regulatory elements. Single-SNP linear regressions allowed first to find which mutation is associated with the different color traits. Then, using the residues of those regressions, multiple-SNP analysis are done with the other SNPs to look for dependent effect of mutations. We must keep in mind that choice of SNP for the first and the following regressions matters (see explanation in figure 1). Their results are really interesting as they find that most of the color traits are associated with a unique set of SNPs (except for one deletion associated with both ventral color and tail stripe), and that no single set of polymorphisms could account for variation across the five traits. Most interestingly, many of those SNPs fell in or near regions containing regulatory elements suggesting that multiple molecular mechanisms are involved in color adaptation in these Sand Hills mice.

One remark can be made about figure 2 panel C of the article, as it is difficult to see differences between the gray and white circles. Or it is something important as the gray circles represent significant SNPs after correction of false discovery…. It is important to note that no gray circles are found for ventral color trait, and that only one red circle is found (significant SNP after false discovery and bonferroni correction). Moreover, PVE (percent of variation of traits explain by SNPs) is 16%, which the smaller value of all traits. This could mean that this trait variation could be under control of other genes that were not sequenced here.


Which lead them to answer the two questions:
- Does single mutation have pleiotropic effect?
The response is mainly no.
- Do mutations have small and independent effects?
The response is yes, with SNPs falling in coding and non-coding (regulatory elements) regions.
It is useful now to test for positive selection on Agouti and SNPs. To do so, they compare a neutral model to a model with selection (created after calculating a coefficient selection) using simulations and a likelihood ratio test. The neutral model is a demographic model that they previously built using dadi. Also in figure 3 panel A, the simulations are done using all haplotypes, but because sweep (recent mutation) is supposed to be associated with light phenotype only, it is important to restricted the simulation after removing the dark haplotypes. On figure 3, y-axis corresponds to values of likelihood ratio (LR). Bigger the values of LR are (big peaks), less the models fit to each other. Also, when LR value is around 0 there is no departure from neutral model to the model under selection. Finally, as you can see on panel B and C, peaks are much more numerous and bigger when restricted to light alleles. Also, panel C is interesting as it zooms on the most strongly associated polymorphism for each trait, and helps to compare results from dark and light morphs (black line = dark haplotypes, colored line = light haplotypes). Peaks in panel B are found to be significant and clustered around the location of SNPs, which is consistent with recent selection acting on, or near, color-associated SNPs in light haplotypes. Finally, results from a comparison between dark and light-associated alleles are concur with multiple targets of selection among the light, but not dark, alleles of Agouti. Last but not least, strength of selection analysis reveal that selection coefficients (estimated using a maximum likelihood approach) are greater in traits linked to light allele compared to traits of dark allele. For example, for d-v boundary traits, selection coefficient s is 0.42 for light allele, and 0.067 for dark allele. Values of s in dark-associated alleles are really small compared to the light-alleles. Moreover, there is a positive correlation between PVE values (percent of variation of traits explain by SNP) and selection coefficient s across all light associated SNP.


To conclude, their results are finally consistent with Fisher geometric model of adaptation. Small and independent effects of mutation can lead to a more important pleiotropy of a gene (as here with agouti locus leading to complex coloration in the deer mice of Nebraska). Finally, Linnen et al. want us to remember that it is individual mutations, not genes that bring population closer to its phenotypic optimum.
From my point of view this Science letter is well written, clear and concise to answer a question that have important impacts in evolutionary biology. A deeper look allows the reader to appreciate the complexity of the issue and the good work done by those researchers.
Linnen, C., Poh, Y., Peterson, B., Barrett, R., Larson, J., Jensen, J., & Hoekstra, H. (2013). Adaptive Evolution of Multiple Traits Through Multiple Mutations at a Single Gene Science, 339 (6125), 1312-1316 DOI: 10.1126/science.1233213
]]>
Pig domestication has started over 10 000 years ago and has had important consequences on human life, changing our agricultural and medical practices. Much has been argued on whether pig was domesticated independently across multiple locations or it was adopted by humans only once and then transported elsewhere. Originally, pig (Sus scrofa) has emerged in the South East Asia during the early Pliocene (~5.3–3.5 Myr ago) and then spread across most of the Eurasian continent. Yet, unraveling the true story of the pig domestication has become possible only recently, with a publication of a near complete pig genome by Groenen et al. featuring the Nature front cover in the November issue 7424, 2012.
Genome assembly
The research team (RT hereafter) made impressive efforts on genome sequencing and assembly. The genome was sequenced with both BAC and NGS technologies. For NGS the RT used 44bp paired-end Illumina library, which was likely the headliner technology from Illumina at the time of the initiation of the porcine genome project. In total, the RT obtained 2.60 Gb of sequencing data and thanks to BAC could assign scaffolds (2.5 Gb) quite precisely to 20 (18+X and Y) chromosomes, leaving only 212 Mb of unplaced scaffolds.
The RT used a very clever strategy for the genome annotation. After screening for repeats, they run a three-staged procedure to ensure that the annotation is of a high quality. First, they run so-called targeted-stage. For this stage, they downloaded from UniProt SwissProt/TrEMBL all pig protein sequences and then matched them against assembled genome with Exonerate/Genewise to predict the models of coding sequence. Second, they applied similarity stage, where they generated additional coding models using proteins from the related species. Thirdly, they obtained RNA-seq data and used it them to search for expressed regions in the genome. Finally, they obtained a consensus prediction for the transcripts based on these three stages (see Fig.1).

identified and 2,965 non-coding RNAs (ncRNAs). Of the protein coding transcripts 3,605 were made from RNASeq only, 15,072 came from proteins from other species. 3,959 transcripts were pig specific, 37 transcripts were mitochondrial.
Evolution of porcine genome compared to other mammalian genomes
As the first analysis, the RT ran the comparison of pig genome with five more mammalian genomes – human, mouse, dog, horse and cow.
First, they extracted only 1:1 orthologous from the total gene set, used branch-site model to calculate the dN/dS ratio and analyzed proteins with accelerated evolution for enrichment for specific biological processes. In general, dS (0.160) and dN/dS ratio (0.144) in pig lineage were similar to other mammals (0.138–0.201) except for the mouse (0.458), suggesting similar evolutionary rates and intermediate level of purifying selection. Specific pathways significantly (P< 0.05) enriched within the pig group are shown on Fig. 2. However, it was not entirely clear if the pathway analysis was corrected for multiple testing.

Second, the RT attempted to analyze a subset of immune-related genes to find out which proteins evolve especially fast and also which gene families have experienced gene-family expansions. The RT thoroughly annotated genes related to immunity and compiled an impressive dataset on gene duplications. However, the analysis itself could have been greatly improved if it was run with a specific hypothesis in mind or at least if there was a more detailed explanation on how exactly gene family evolution was investigated. Have they used a birth-death model? Was it a simple Student t-test? Unfortunately, the Supplementary Information just like the article itself, leave the reader only wondering about it. The results of the “unknown” analysis, nevertheless, suggest that in porcine genome there are expansions of IFN, IL1B, CD36, CD68, CD163, CRP and IFIT1 genes. Interested reader may want to check out yet another paper from the same RT that deals exclusively with the evolution of the porcine immunome.
I am going to put aside the whole part on genome re-arrangements, conservation of synteny and evolutionary breakpoints as not to expand the blog post to unreadable size.
Analyze population divergence and domestication
The second part of the article deals primarily with the history of the pig population and highlights some interesting insights into pig domestication.
To run this part of the analysis, the RT has additionally sequenced 4 Asian and 6 European wild boars and compiled a dataset on single nucleotide polymorphisms for each individual (the dataset included both wild individuals and domesticated breeds from the previous part). As expected, the nucleotide heterozygocity is higher among Asian wild boars compared to European (see Fig. 3a). Furthermore, high peaks of low heterozygocity among European wild boars may evidence a past bottleneck which the population experienced when migrating out from Asia. In contrast, the nucleotide heterozygocity of pig breeds (i.e. domesticated pig) shows quite a surprising pattern (Fig. 3b): (1) the genetic heterozygocity is relatively similar between European and Asian breeds; and (2) not only this diversity is only mildly reduced in Asian breeds compared to Asian wild individuals, but also the diversity of European breeds is higher compared to European wild boars. What might explain such pattern?

Sadly, the story behind this pattern is greatly simplified in the article itself, and lots of interesting details and discussions are left aside for the Supplementary Materials. Just in brief, the RT found a clear signal of admixture between wild Asian and European boars and between European and Asian breeds. For wild individuals they suggest that it may be multiple migrations of Asian wild boars across Eurasia during the later stage of the Pleistocene that produced an admixture signal between wild boars.
For domesticated breeds the story is rather complex and includes multiple causes of admixture such as trading of Asian breeds and mixing it with European ones in late 18th and 19th centuries, multiple domestication origins, husbandry practices and incomplete lineage sorting. The only clear conclusions are that (1) domestication of wild boar has happened at least twice and independently in Asia and Europe (2) there were numerous admixture events between wild boars from Asia and Europe (late Pleistocene), between domesticated breeds with wild boars in both Europe and Asia (over 10 000 years), and finally between domesticated breeds of Europe and domesticated breeds of Asia (18-20th centuries).
The second part of the story tells us about the demographic history of Asian and European populations. For this analysis the RT used a pair-wise sequentially Markovian coalescence model. They find that the population of wild boar has increased in size once arriving into Europe, but then both European and Asian population showed a decline in population size and this decline is much more pronounced in European population (Fig. 4). The RT team suggests that population size declines due to climatic oscillations with a down peak around Last Glacial Maximum (20 000 years ago). However, personally, I would not disregard hunting practices as potential cause of wild boar population decline, because humans have already populated Eurasia at that time and probably knew how to hunt boars. Another detail that could have been worth adding is confidence intervals on demographic history – for now the reader is left with a guess on how accurate the observed lines are.

Lastly, the RT looked at the selective sweeps on the pig genome and for this part of analysis they followed strategy from Green et al. 2010. In general, they find that regions with putative selective sweeps are over-represented with genes involved into RNA splicing and RNA processing. However, they exclude completely from the analysis non-protein coding regions, while it would be clearly interesting to look at given that they find a quite some sweeps associated with genes involved with RNA splicing and processing.
In sum, the paper is incredibly dense, includes various kinds of analyses and results, and to me looks like an overview of 10 years of great work of dozens of people. I believe we are going to see (and already seeing) more detailed papers on each section of this article and each of these future publications will unravel fascinating details on evolution of pig genome from different biological perspectives.
Groenen MA, Archibald AL, Uenishi H, Tuggle CK, Takeuchi Y, Rothschild MF, Rogel-Gaillard C, Park C, Milan D, Megens HJ, Li S, Larkin DM, Kim H, Frantz LA, Caccamo M, Ahn H, Aken BL, Anselmo A, Anthon C, Auvil L, Badaoui B, Beattie CW, Bendixen C, Berman D, Blecha F, Blomberg J, Bolund L, Bosse M, Botti S, Bujie Z, Bystrom M, Capitanu B, Carvalho-Silva D, Chardon P, Chen C, Cheng R, Choi SH, Chow W, Clark RC, Clee C, Crooijmans RP, Dawson HD, Dehais P, De Sapio F, Dibbits B, Drou N, Du ZQ, Eversole K, Fadista J, Fairley S, Faraut T, Faulkner GJ, Fowler KE, Fredholm M, Fritz E, Gilbert JG, Giuffra E, Gorodkin J, Griffin DK, Harrow JL, Hayward A, Howe K, Hu ZL, Humphray SJ, Hunt T, Hornshøj H, Jeon JT, Jern P, Jones M, Jurka J, Kanamori H, Kapetanovic R, Kim J, Kim JH, Kim KW, Kim TH, Larson G, Lee K, Lee KT, Leggett R, Lewin HA, Li Y, Liu W, Loveland JE, Lu Y, Lunney JK, Ma J, Madsen O, Mann K, Matthews L, McLaren S, Morozumi T, Murtaugh MP, Narayan J, Nguyen DT, Ni P, Oh SJ, Onteru S, Panitz F, Park EW, Park HS, Pascal G, Paudel Y, Perez-Enciso M, Ramirez-Gonzalez R, Reecy JM, Rodriguez-Zas S, Rohrer GA, Rund L, Sang Y, Schachtschneider K, Schraiber JG, Schwartz J, Scobie L, Scott C, Searle S, Servin B, Southey BR, Sperber G, Stadler P, Sweedler JV, Tafer H, Thomsen B, Wali R, Wang J, Wang J, White S, Xu X, Yerle M, Zhang G, Zhang J, Zhang J, Zhao S, Rogers J, Churcher C, & Schook LB (2012). Analyses of pig genomes provide insight into porcine demography and evolution. Nature, 491 (7424), 393-8 PMID: 23151582
]]>by Ricardo Kanitz, based on the paper by Hernandez et al. published in Science (2011).
One of the main topics in evolution is – as it has always been – human evolution. Many new methods are applied first to humans; other methods, which are not applied there, often come to humans at some point anyway. This is particularly true in the field of genomics and it is no surprise since we are talking about our own species’ evolution. The study commented here addresses an interesting general question in the subject. How selection shaped (if at all) our genomes?

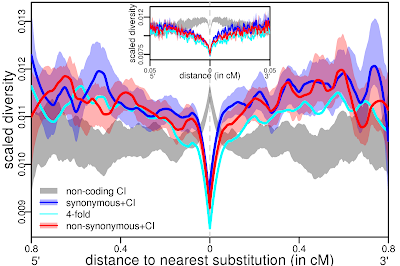

As it follows, they proposed a scenario of background purifying selection to explain the observed pattern. In Figure 3B above, they showed the fit of simulations with background selection (purple, green and orange) with the observations (dark blue, light blue and red). Such a fit appears to be very good and they conclude that the pattern they observed is better explained by purifying selection (a.k.a. strict neutrality) than by recurrent positive selection.
Finally, given (1) the fact that the observations did not fit the predictions of their (rather extreme) selection model, and (2) that a neutral model was able to explain the observations, the general conclusion is that classic selective sweeps resulting from strong positive selection were quite rare in the recent human evolution.
Although it would be interesting to see how the results would look like with lower (and more realistic) values for ? and s, this study brings about the interesting discussion of the modus operandi of human adaptation. Classical examples based on phenotypes show that humans underwent recurrent adaptations when it comes to diet, immune response and skin pigmentation. The molecular mechanisms underlying these, however, might not be as simple as the “Classic Selective Sweeps”. Complex genetic architectures linking small effect polygenic variants, for example, may lead to soft sweeps; which do not leave the same sort of signature and can easily be missed in the background noise created by the potentially overwhelming neutral evolution. Therefore, there are still many unknown features related to recent human evolution – especially concerning non-neutral evolution – and the growing availability of data coupled with better analytical methods may bring new and possibly surprising results in the coming years of scientific investigation.
 |
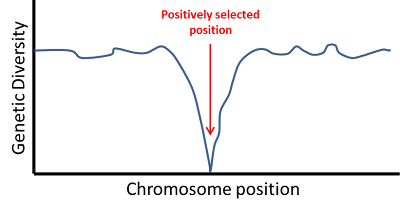
| An example of classic selective sweep pattern. As the distance from the selected nucleotide increases, diversity increases. Fig. 2 from Hernandez et al. 2011. |
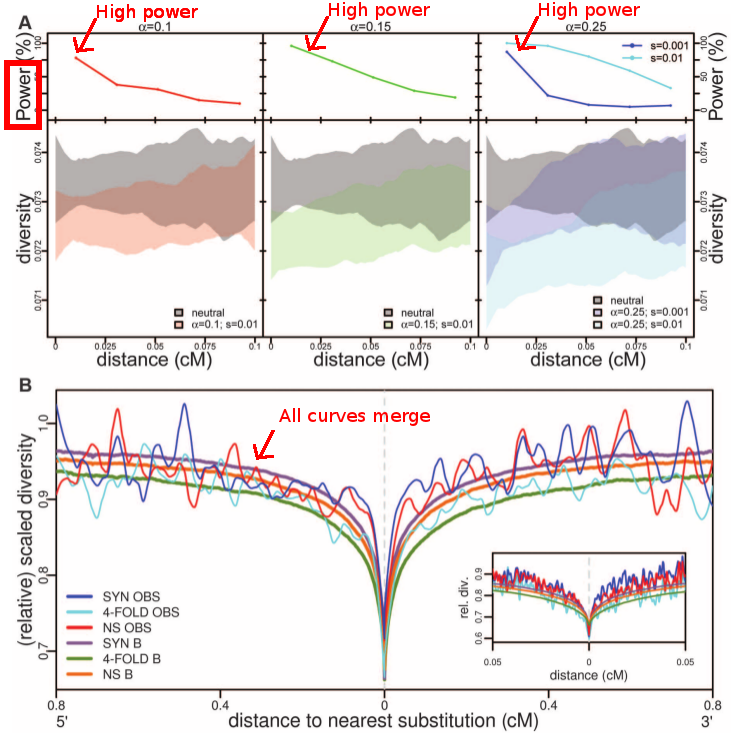 |
| Comparison of simulations under a neutral model with a model with selection, and the actual human genomes data. What is interesting in panel A is that the power is strong for all fractions of the genome under selection the authors tested (alpha parameter). Therefore the authors claim that if classic selective sweeps are frequent in the population, we should be able to detect a significant departure from neutrality. Panel B completes the argument as we can see that all curves (neutral model and human genome data) are merged. Considering that we should have the power to detect a departure from neutrality, the authors claim that the neutral scenario cannot be rejected. Fig. 3 from Hernandez et al. 2011. |
Hernandez, R., Kelley, J., Elyashiv, E., Melton, S., Auton, A., McVean, G., , ., Sella, G., & Przeworski, M. (2011). Classic Selective Sweeps Were Rare in Recent Human Evolution Science, 331 (6019), 920-924 DOI: 10.1126/science.1198878
]]>