General descriptive statistics
Evolution of SET
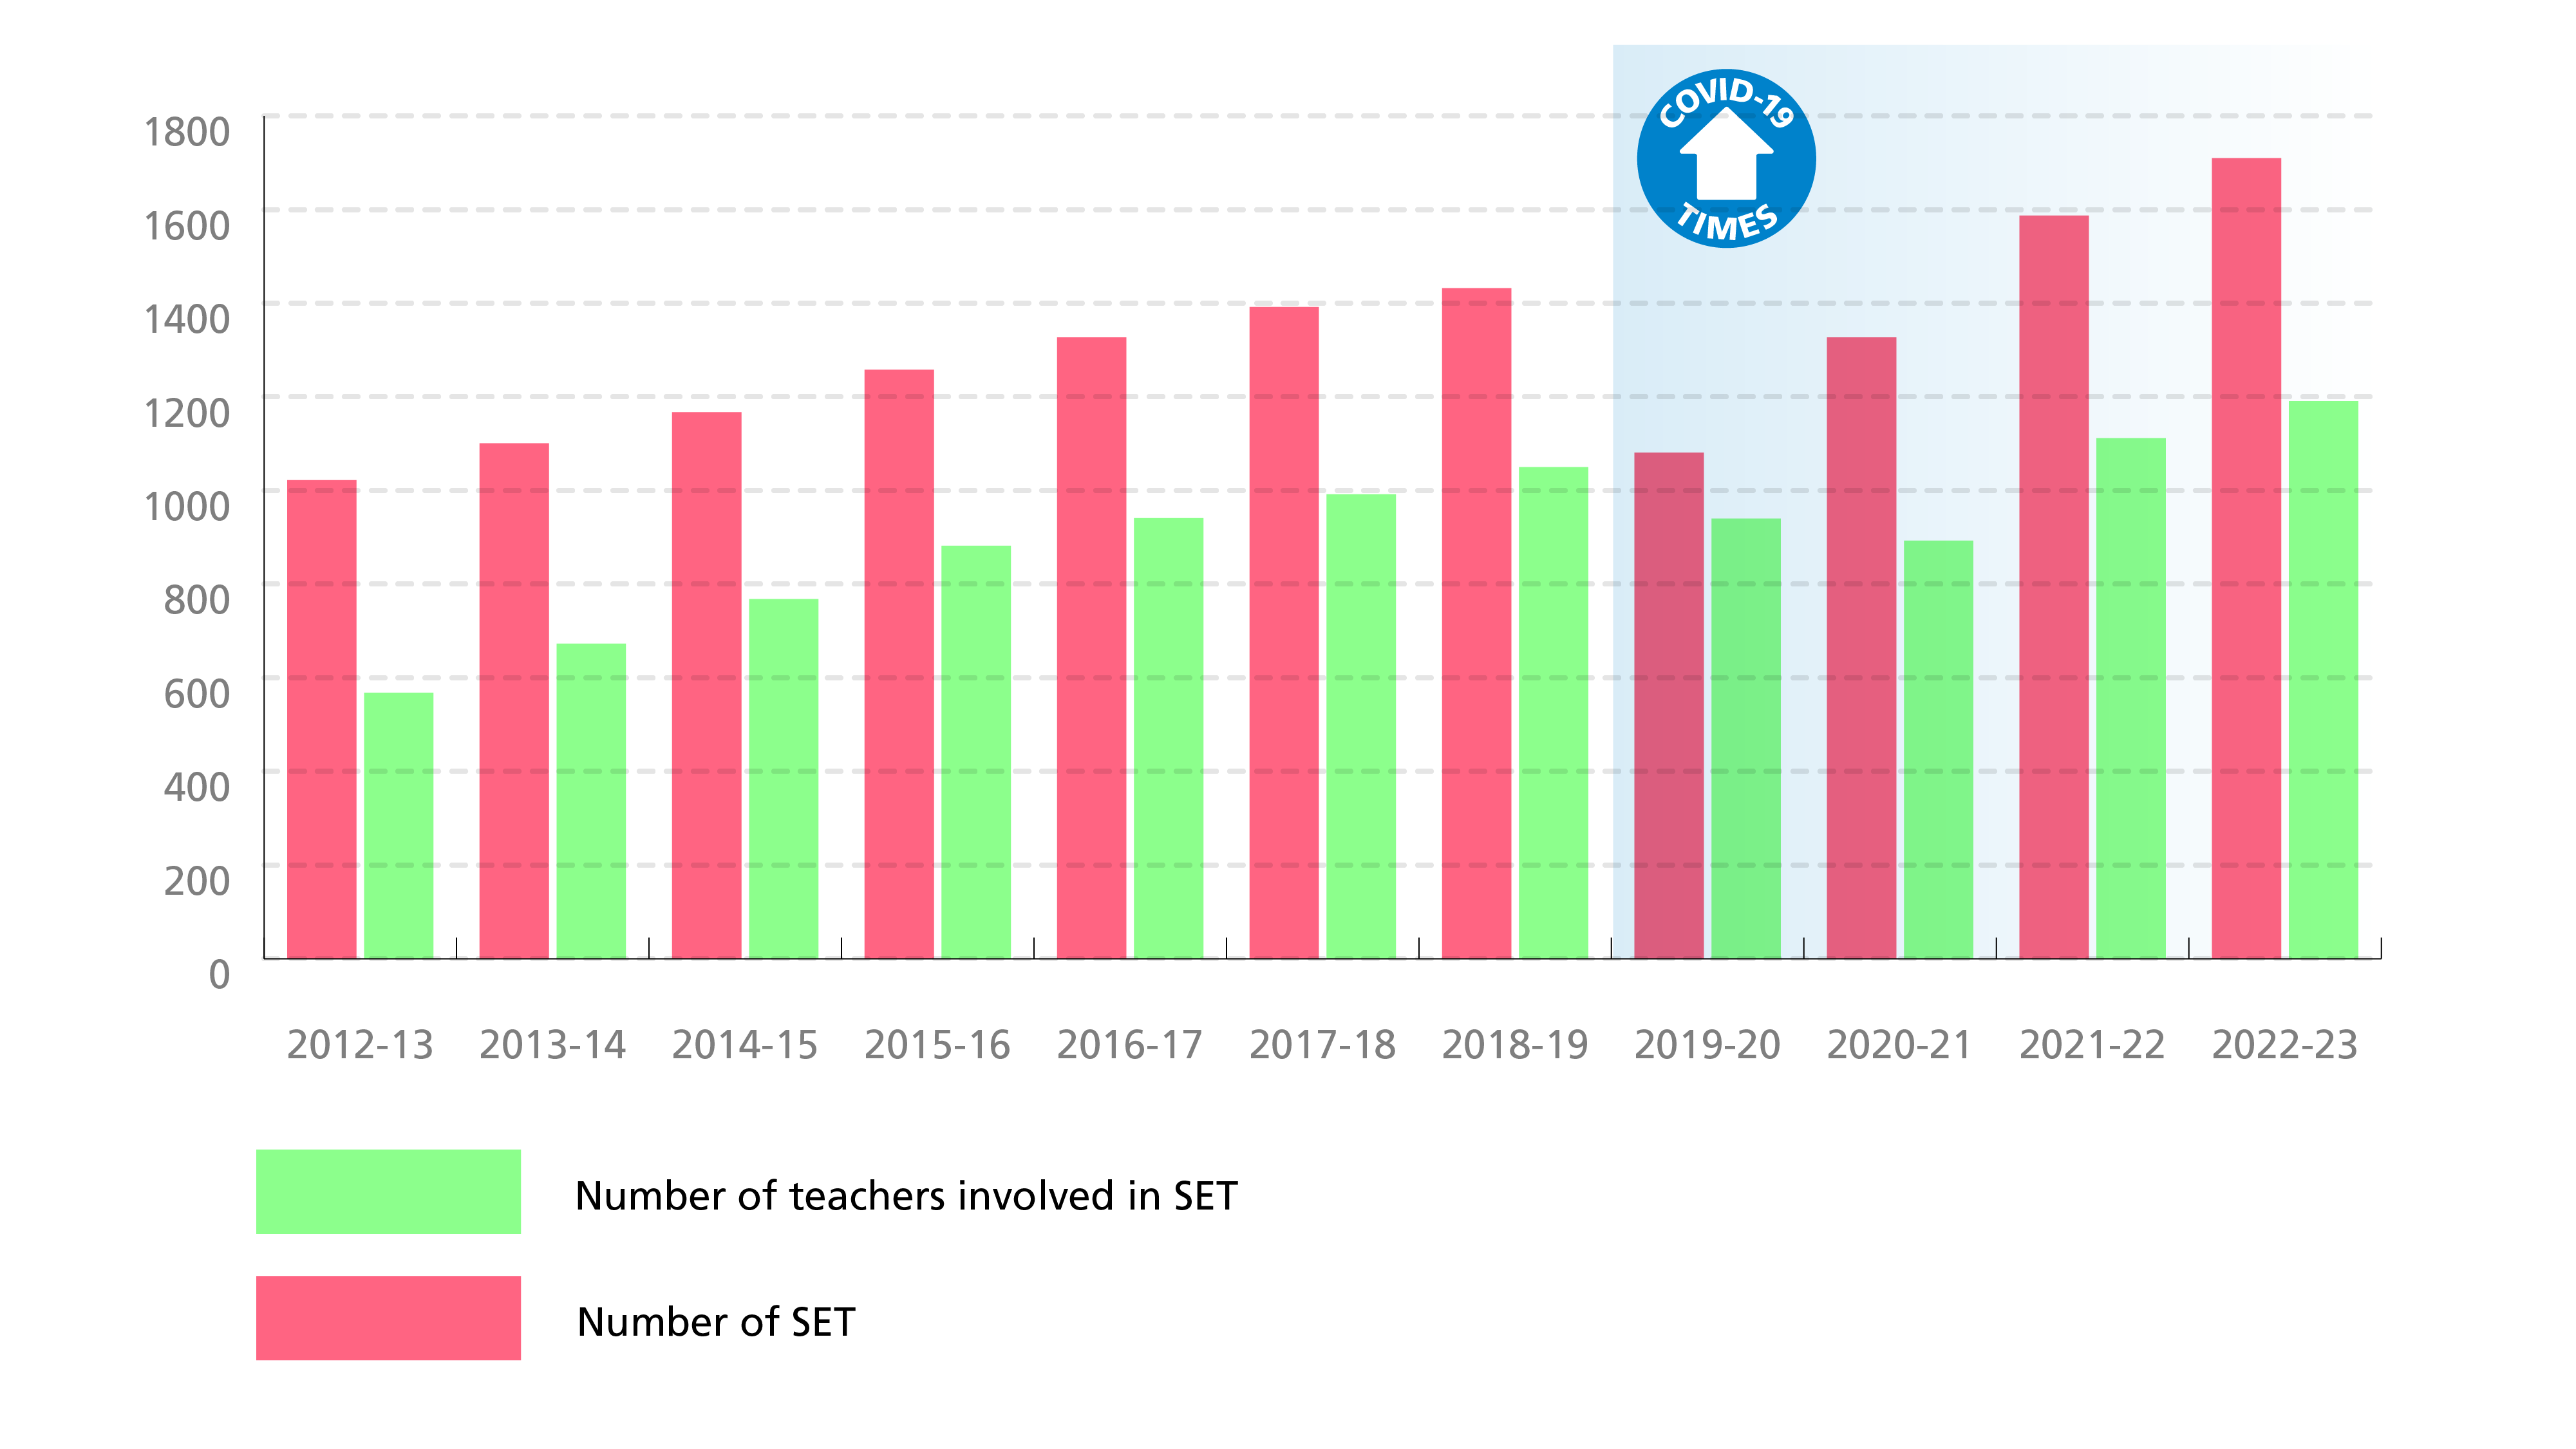
The graph below shows the evolution of the total number of teaching evaluated by students, using different tools and methods proposed or developed with the CSE (questionnaires, Focus Group, Photo-expression), per academic year. The number of teachers involved in the process is also presented.
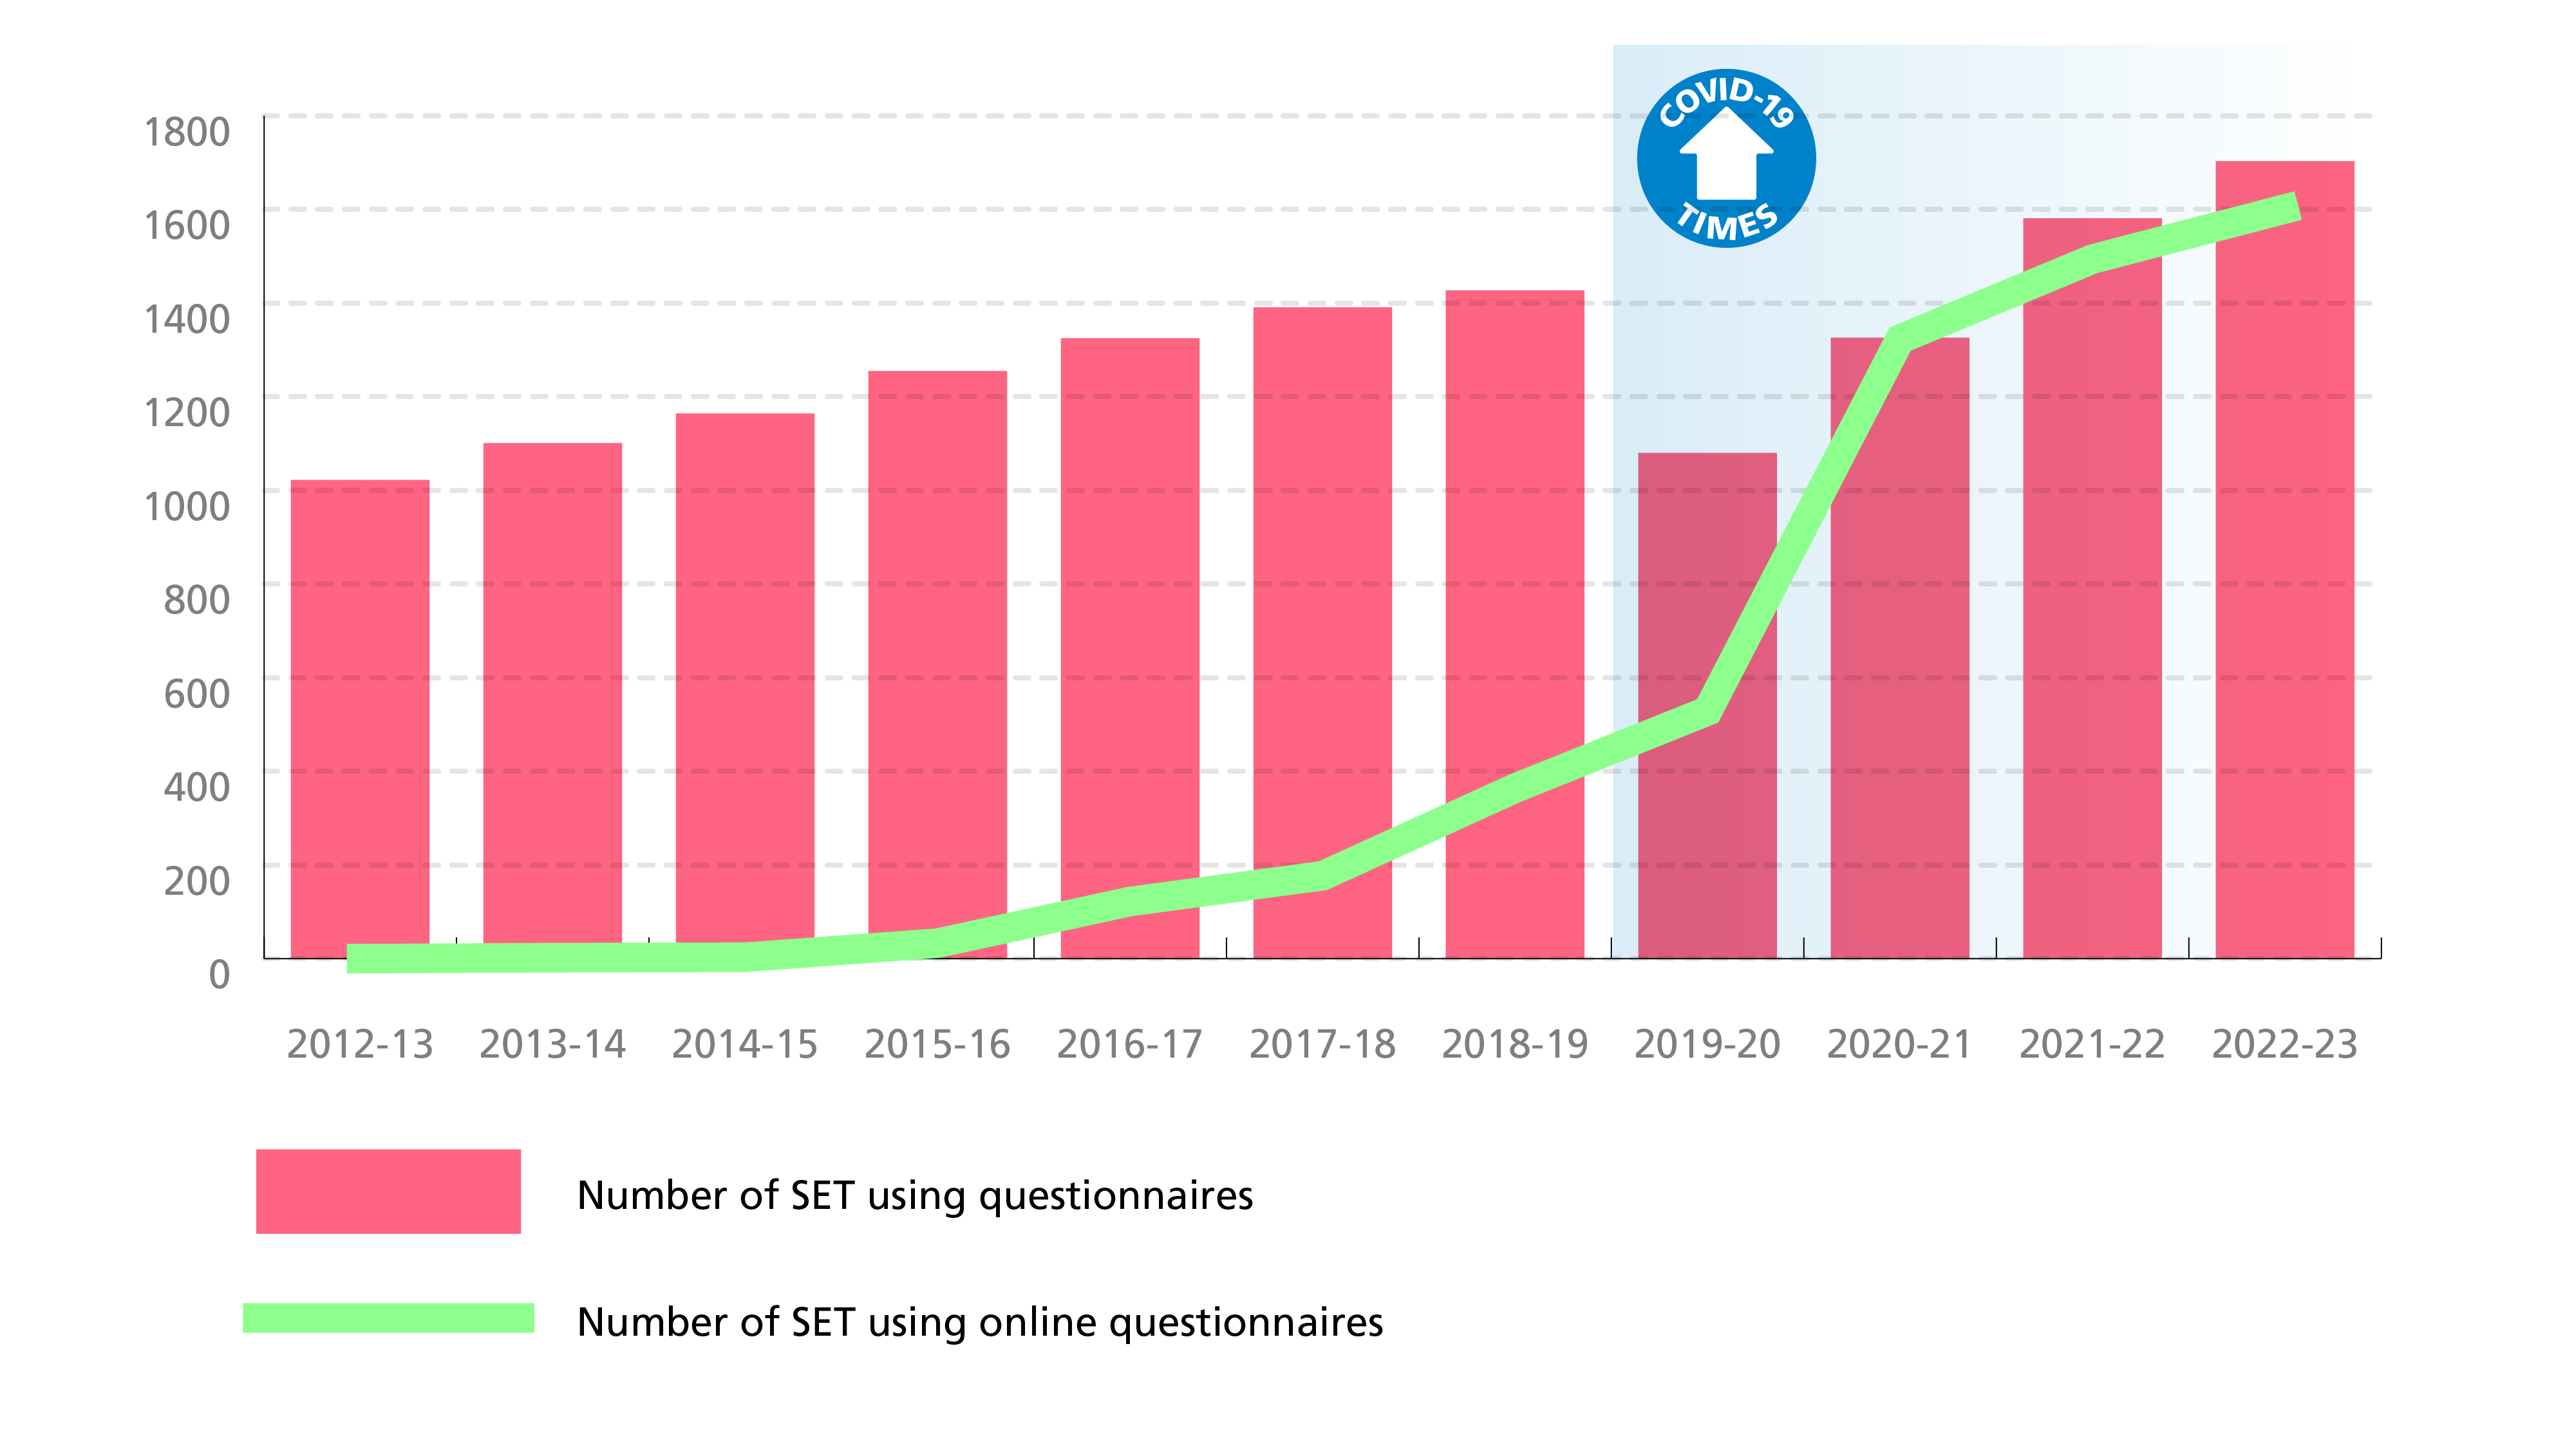
SET using questionnaires
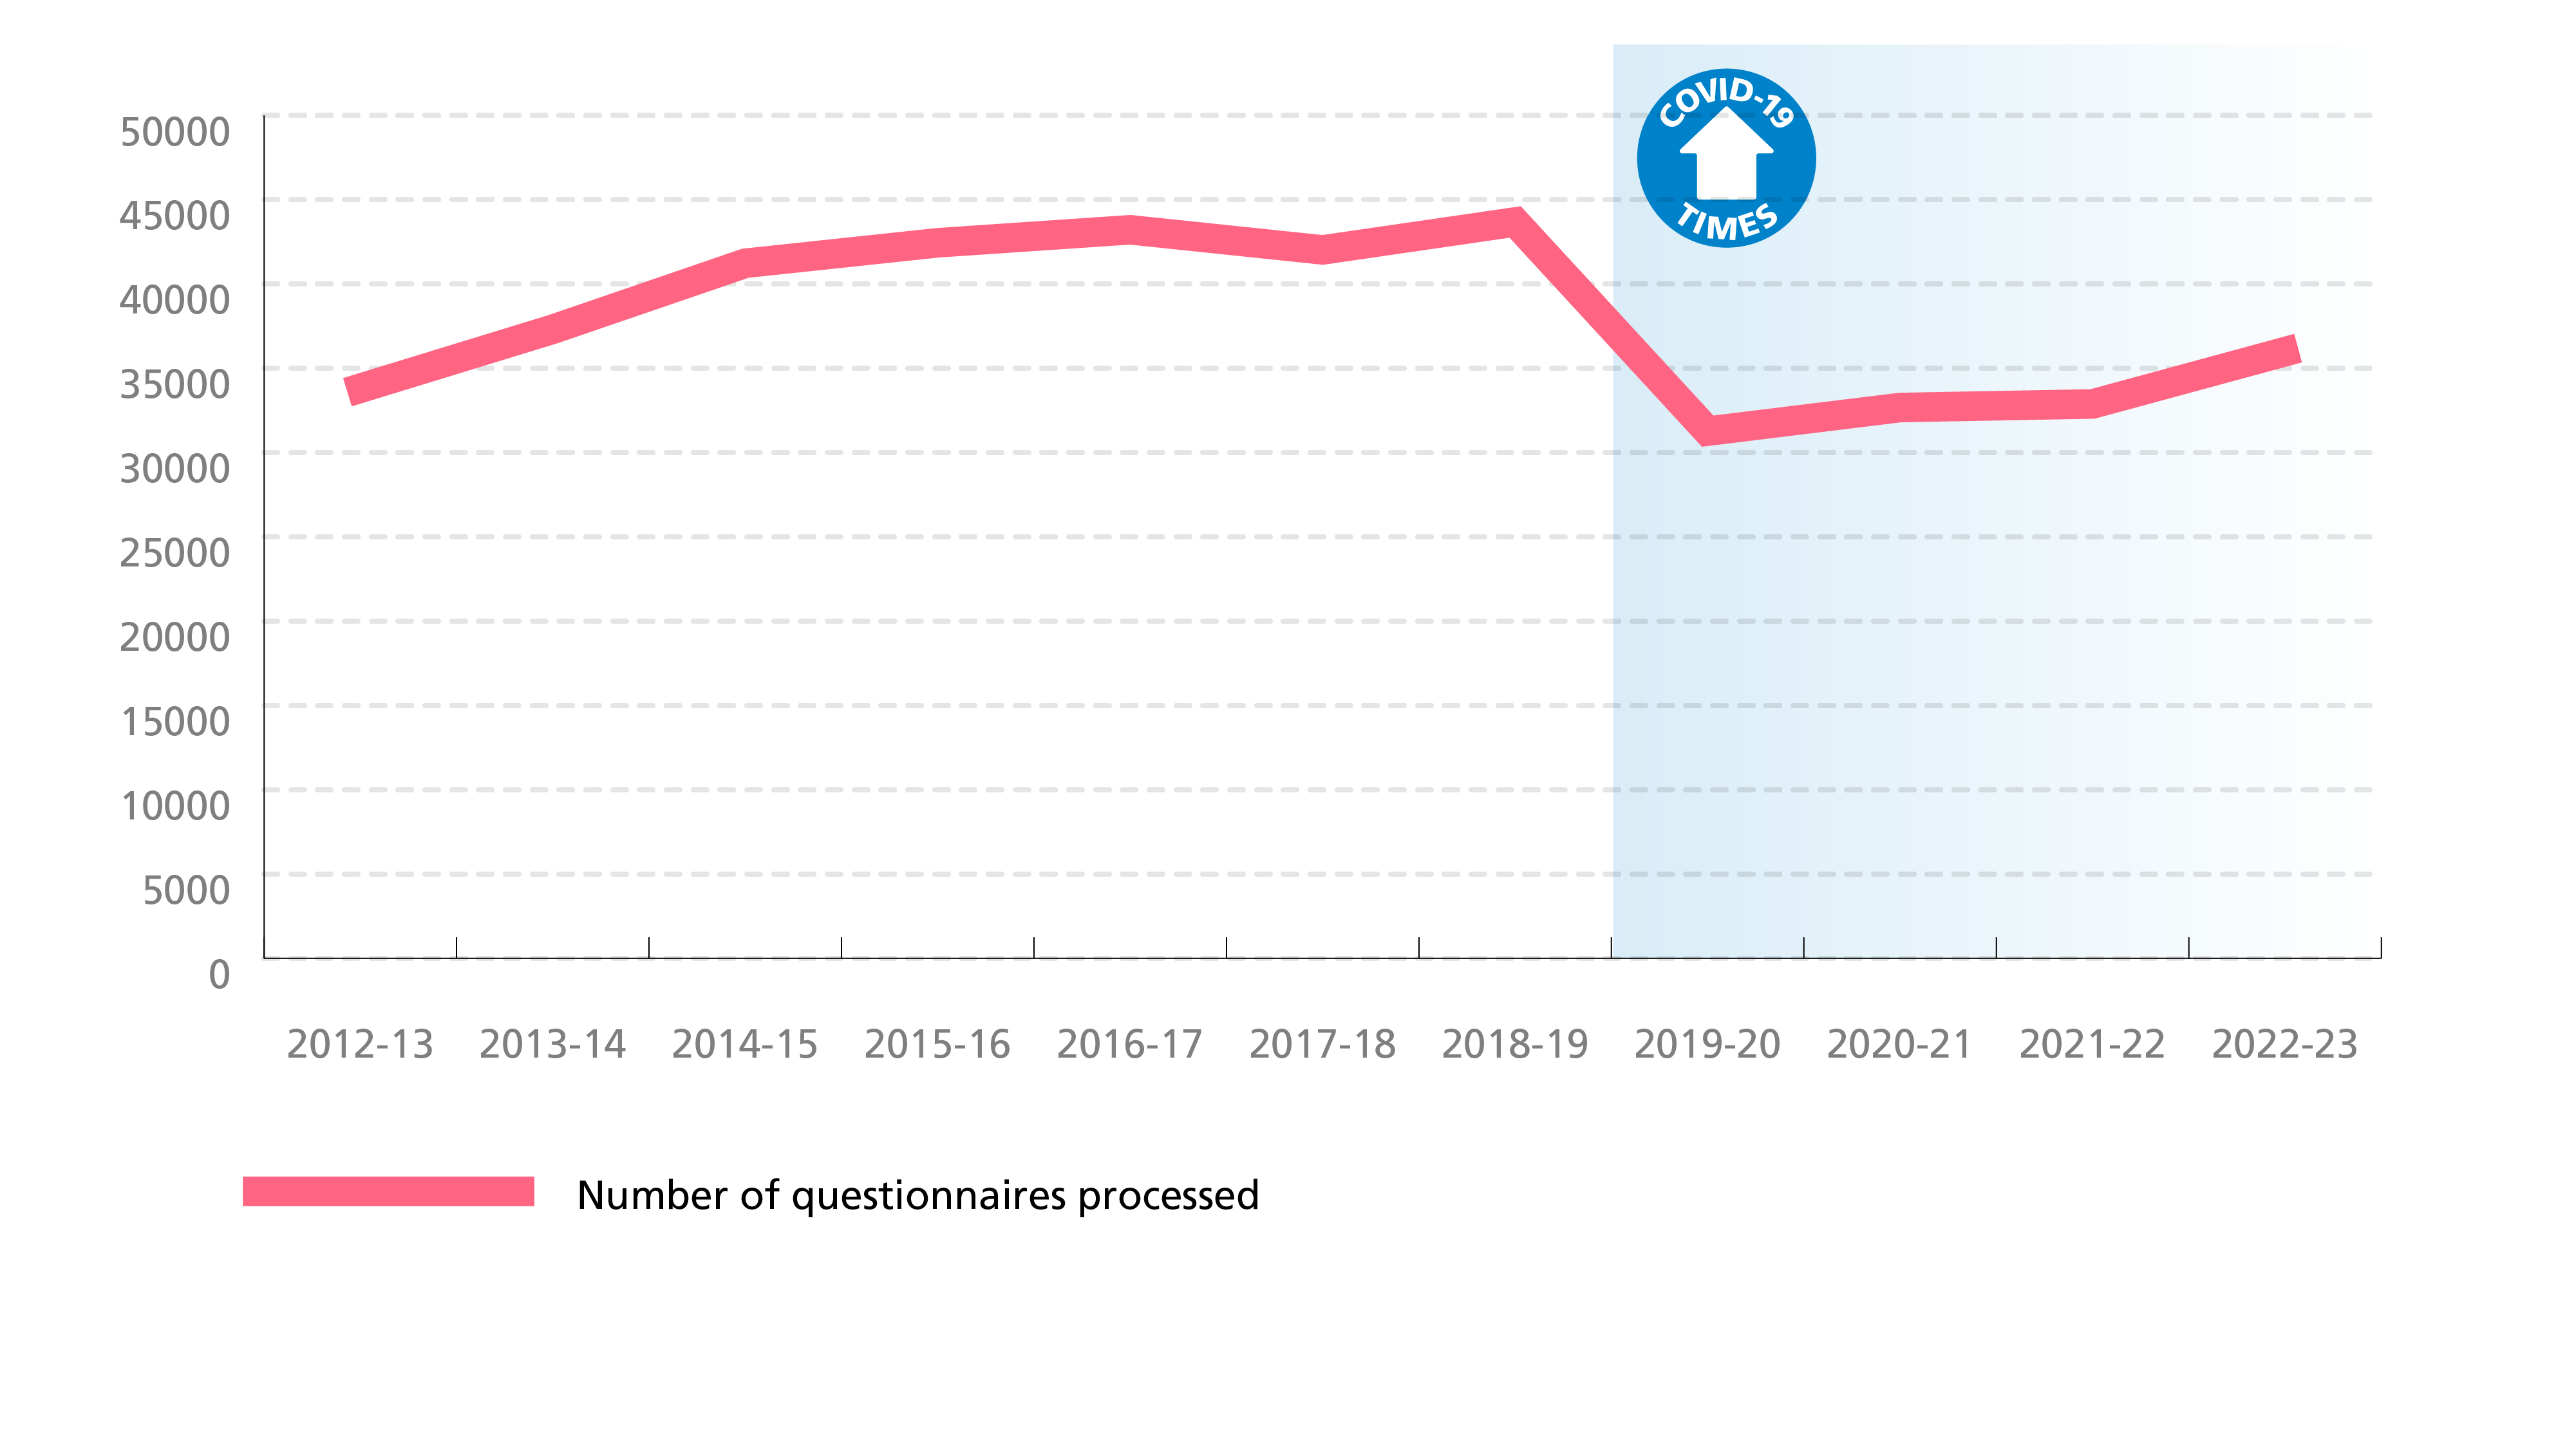
The graphs below show the number of courses evaluated by students using questionnaires, according to their format (online or paper), and the number of questionnaires processed per academic year.